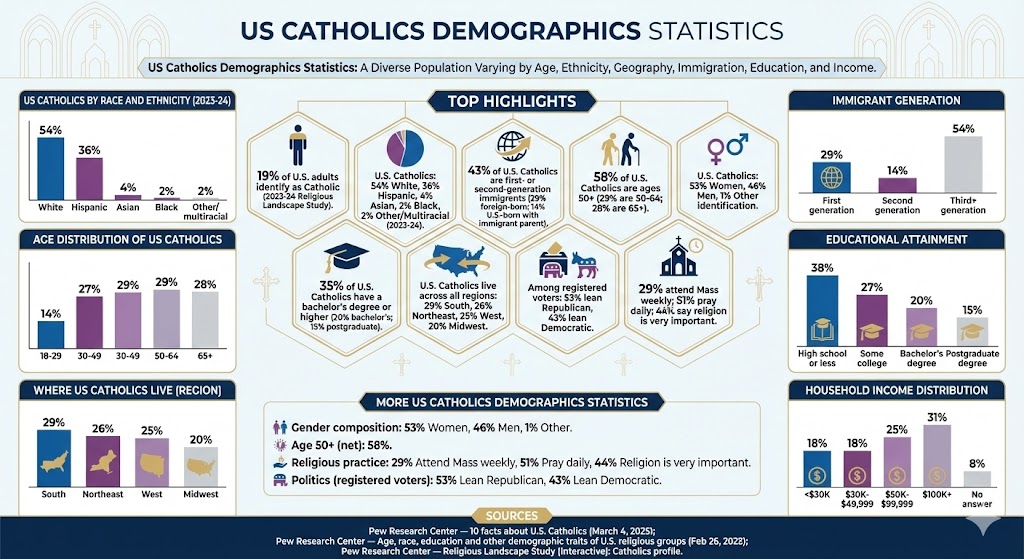
US Catholics demographics statistics show a large, diverse population that varies widely by age, ethnicity, geography, immigration background, education, and income.
US catholics demographics statistics
US Catholics Demographics Statistics (Top Highlights)
19% of U.S. adults identify as Catholic (2023-24 Religious Landscape Study).
U.S. Catholics are 54% White, 36% Hispanic, 4% Asian, 2% Black, and 2% other/multiracial (2023-24).
43% of U.S. Catholics are first- or second-generation immigrants (29% foreign-born; 14% U.S.-born with an immigrant parent).
58% of U.S. Catholics are ages 50+ (29% are 50-64; 28% are 65+).
U.S. Catholics are 53% women, 46% men, and 1% identify in some other way.
35% of U.S. Catholics have a bachelor’s degree or higher (20% bachelor’s; 15% postgraduate).
31% of U.S. Catholics report household income of $100K+; 18% report under $30K.
U.S. Catholics live across all regions: 29% South, 26% Northeast, 25% West, 20% Midwest.
Among registered voters, 53% of Catholics identify with or lean Republican and 43% identify with or lean Democratic.
29% of U.S. Catholics say they attend Mass weekly or more often; 51% pray daily; 44% say religion is very important in their lives.
US Catholics by Race and Ethnicity
In the 2023-24 Religious Landscape Study, a majority of U.S. Catholics are White (non-Hispanic), and more than a third are Hispanic.
Label
Bar
Value
White
54%
Hispanic
36%
Asian
4%
Black
2%
Other/multiracial
2%
Max = 54. Widths: White 100.00%, Hispanic 66.67%, Asian 7.41%, Black 3.70%, Other/multiracial 3.70%
Age Distribution of US Catholics
U.S. Catholics skew older than the general population, with a majority ages 50 and up.
U.S. Catholics are relatively evenly distributed across regions, with the largest share living in the South.
Label
Bar
Value
South
29%
Northeast
26%
West
25%
Midwest
20%
Max = 29. Widths: South 100.00%, Northeast 89.66%, West 86.21%, Midwest 68.97%
Immigrant Generation
Immigration is a defining demographic feature of U.S. Catholicism, with sizable first- and second-generation shares.
Label
Bar
Value
First generation
29%
Second generation
14%
Third+ generation
54%
Max = 54. Widths: First generation 53.70%, Second generation 25.93%, Third+ generation 100.00%
Educational Attainment
In the 2023-24 Religious Landscape Study, 35% of U.S. Catholics report a bachelor’s degree or higher, while 38% have a high school education or less.
Label
Bar
Value
High school or less
38%
Some college
27%
Bachelor’s degree
20%
Postgraduate degree
15%
Max = 38. Widths: High school or less 100.00%, Some college 71.05%, Bachelor’s degree 52.63%, Postgraduate degree 39.47%
Household Income Distribution
Income among U.S. Catholics spans all brackets; in the 2023-24 Religious Landscape Study, 31% report household income of $100K+.
Label
Bar
Value
<$30K
18%
$30K-$49,999
18%
$50K-$99,999
25%
$100K+
31%
No answer
8%
Max = 31. Widths: <$30K 58.06%, $30K-$49,999 58.06%, $50K-$99,999 80.65%, $100K+ 100.00%, No answer 25.81%
More US Catholics Demographics Statistics
Gender composition among U.S. Catholics: 53% women, 46% men, 1% identify in some other way.
Age 50+ among U.S. Catholics: 58% (net).
Religious practice among U.S. Catholics: 29% attend Mass weekly or more often; 51% pray daily; 44% say religion is very important.
Politics (registered voters): 53% identify with or lean Republican; 43% identify with or lean Democratic.
Sources
Pew Research Center — 10 facts about U.S. Catholics (March 4, 2025): https://www.pewresearch.org/short-reads/2025/03/04/10-facts-about-us-catholics/
Pew Research Center — Age, race, education and other demographic traits of U.S. religious groups (Feb 26, 2025): https://www.pewresearch.org/religion/2025/02/26/age-race-education-and-other-demographic-traits-of-us-religious-groups/
Pew Research Center — Religious Landscape Study (Interactive): Catholics profile: https://www.pewresearch.org/religious-landscape-study/religious-tradition/catholic/
Navigate through ten exquisite religious Christmas tree ornaments that embody the spirit of faith; discover which ones will transform your holiday decor.
Learn about the 10 best personalized home blessing plaques that can beautifully enhance your space and reflect your family's values—find the perfect one for your home!