Christian divorce statistics can be confusing because “divorce rate” gets used to mean different things (divorces per year, share of adults who are divorced, or share of ever-married people who have divorced). Below is a data-first snapshot using Pew Research Center’s newest U.S. Religious Landscape Study results (2023-24) plus a Pew deep-dive survey on Catholics and family life.
Christian Divorce Statistics (Top Highlights)
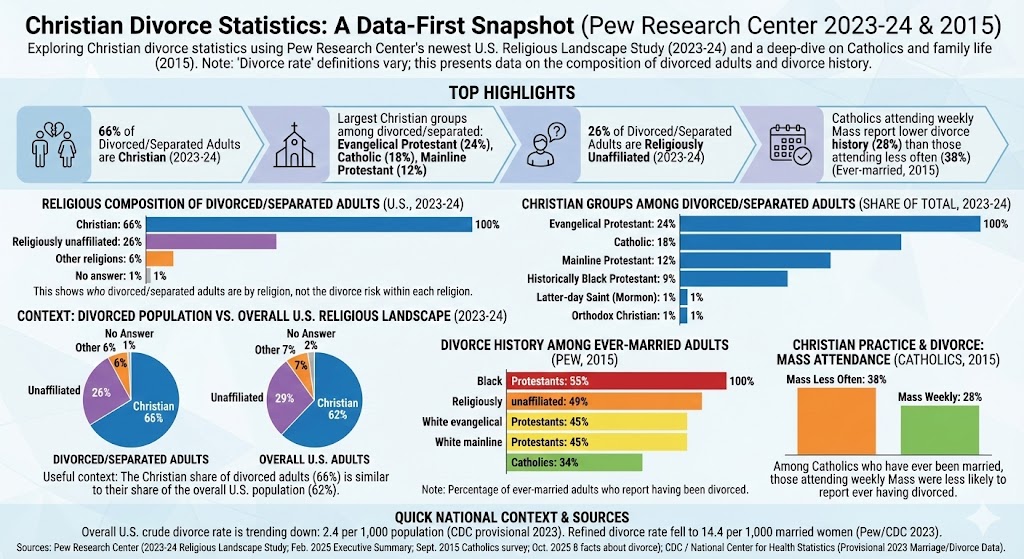
- In Pew Research Center’s 2023-24 U.S. Religious Landscape Study, 66% of divorced/separated adults identify as Christian.
- Among divorced/separated adults, the biggest Christian groups are evangelical Protestants (24%), Catholics (18%), mainline Protestants (12%), and historically Black Protestants (9%).
- Among divorced/separated adults, 26% are religiously unaffiliated (4% atheist, 4% agnostic, 18% “nothing in particular”).
- In the overall U.S. adult population (2023-24), 62% identify as Christian and 29% are religiously unaffiliated.
- In a Pew survey on U.S. Catholics and family life (2015), 34% of ever-married Catholics reported they had been divorced; weekly Mass attenders reported a lower divorce history (28%) than Catholics who attended less often (38%).
Religious composition of divorced/separated adults (U.S., 2023-24)
This shows who divorced/separated adults are (by religion), not the divorce risk within each religion.
| Label | Bar | Value |
|---|---|---|
| Christian | 66% | |
| Religiously unaffiliated | 26% | |
| Other religions | 6% | |
| No answer | 1% |
Max = 66%. Widths: Christian 100.00%, Religiously unaffiliated 39.39%, Other religions 9.09%, No answer 1.52%.
Which Christian groups make up the largest shares of divorced/separated adults? (2023-24)
This breakdown is within the divorced/separated population (not a within-group divorce rate).
| Label | Bar | Value |
|---|---|---|
| Evangelical Protestant | 24% | |
| Catholic | 18% | |
| Mainline Protestant | 12% | |
| Historically Black Protestant | 9% | |
| Latter-day Saint (Mormon) | 1% | |
| Orthodox Christian | 1% |
Max = 24%. Widths: Evangelical Protestant 100.00%, Catholic 75.00%, Mainline Protestant 50.00%, Historically Black Protestant 37.50%, Latter-day Saint (Mormon) 4.17%, Orthodox Christian 4.17%.
How this compares to the overall U.S. religious landscape (2023-24)
Pew’s 2023-24 Religious Landscape Study estimates that 62% of U.S. adults are Christian, 29% are religiously unaffiliated, and 7% belong to non-Christian religions. That’s useful context when interpreting who shows up in the divorced/separated population.
| Label | Bar | Value |
|---|---|---|
| Christian | 62% | |
| Religiously unaffiliated | 29% | |
| Other religions | 7% |
Max = 62%. Widths: Christian 100.00%, Religiously unaffiliated 46.77%, Other religions 11.29%.
Divorce history among ever-married adults (Pew, 2015)
Another way to look at Christian divorce statistics is to ask ever-married people whether they’ve experienced divorce. In Pew’s 2015 analysis, Catholics were lower than several other major groups, while Black Protestants were higher.
| Label | Bar | Value |
|---|---|---|
| Black Protestants | 55% | |
| Religiously unaffiliated | 49% | |
| White evangelical Protestants | 45% | |
| White mainline Protestants | 45% | |
| Catholics | 34% |
Max = 55%. Widths: Black Protestants 100.00%, Religiously unaffiliated 89.09%, White evangelical Protestants 81.82%, White mainline Protestants 81.82%, Catholics 61.82%.
Christian practice and divorce: an example using Mass attendance
Pew’s 2015 Catholic survey found a sizable gap by attendance: Catholics who attend Mass weekly were less likely to report ever having divorced than those who attended less often (among Catholics who have ever been married).
| Label | Bar | Value |
|---|---|---|
| Mass less often | 38% | |
| Mass weekly | 28% |
Max = 38%. Widths: Mass less often 100.00%, Mass weekly 73.68%.
Quick context: the overall U.S. divorce rate has been trending down
For a national baseline, CDC provisional figures for 2023 report a crude divorce rate of 2.4 divorces per 1,000 population (from reporting states and D.C.). Pew’s summary of federal data also notes the refined divorce rate has fallen to 14.4 divorces per 1,000 married women in 2023.
Sources
- Pew Research Center — Religious Landscape Study (2023-24) interactive: “Divorced/separated people” (religious composition of divorced/separated adults).
- Pew Research Center (Feb. 26, 2025) — “Religious Landscape Study: Executive summary” (current religious composition of U.S. adults, including Christian and unaffiliated shares).
- Pew Research Center (Sept. 2, 2015) — “Catholics’ views on marriage, divorce and family life” (divorce history among ever-married Catholics and comparisons to other groups; Mass attendance gap).
- CDC / National Center for Health Statistics — FastStats: “Marriage and Divorce” (provisional 2023 marriages/divorces and crude divorce rate; reporting coverage noted on the page).
- Pew Research Center (Oct. 16, 2025) — “8 facts about divorce in the United States” (refined divorce rate levels and trend, including 2023).