These US Protestant demographics statistics summarize the latest large-sample survey estimates for how many Americans identify as Protestant, how Protestants break down across the three major Protestant traditions, and what the Protestant population looks like by age, race/ethnicity, education, income, and gender.
US protestant demographics statistics
US Protestant Demographics Statistics (Top Highlights)
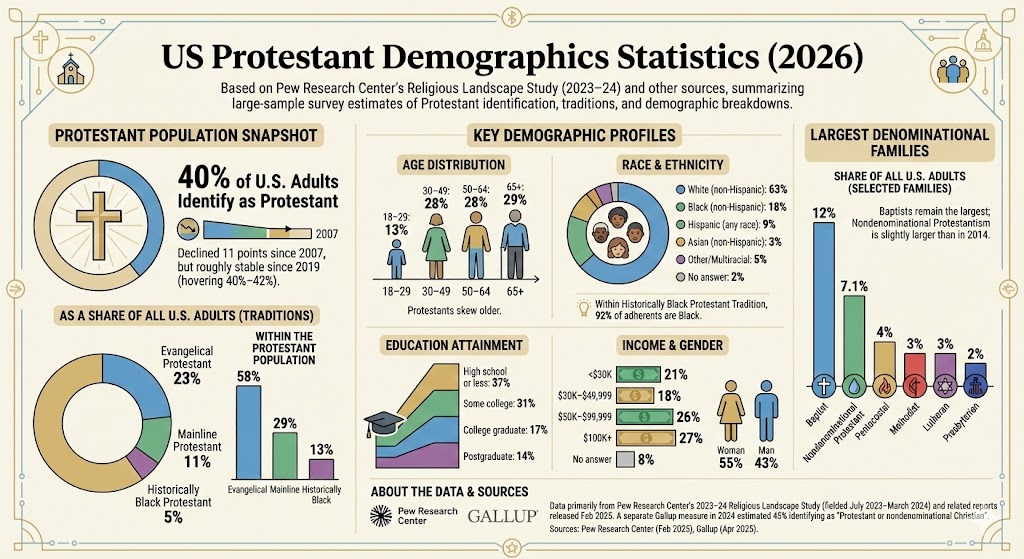
40% of U.S. adults identify as Protestant (Pew Research Center, Religious Landscape Study 2023–24; fielded July 2023–March 2024).
The Protestant share is 11 percentage points lower than in 2007, but has been roughly stable since 2019 (hovering around 40%–42%).
As a share of all U.S. adults: Evangelical Protestants = 23%, Mainline Protestants = 11%, and Historically Black Protestants = 5%.
Within the Protestant population: 58% are Evangelical Protestant, 29% are Mainline Protestant, and 13% are Historically Black Protestant (Pew RLS interactive).
The largest Protestant denominational family is Baptist (12% of U.S. adults), followed by nondenominational Protestant (7.1%) and Pentecostal (4%).
Protestants skew older: 29% are ages 65+, while 13% are ages 18–29.
Racial/ethnic makeup of Protestants (2023–24): 63% White (non-Hispanic), 18% Black (non-Hispanic), 9% Hispanic, 3% Asian (non-Hispanic), 5% other/multiracial.
In the Historically Black Protestant tradition, 92% of adherents are Black (Pew RLS main report).
Education among Protestants: 37% have high school or less, 31% some college, 17% college graduate, 14% postgraduate.
Household income among Protestants: 27% are $100K+ and 21% are under $30K (Pew RLS interactive).
How many Americans are Protestant?
Pew’s 2023–24 Religious Landscape Study estimates that 40% of U.S. adults identify as Protestant. A separate Gallup measure (using a different question and grouping) estimated 45% of Americans identified as “Protestant or nondenominational Christian” in 2024, which is not strictly the same category as “Protestant” in Pew’s typology.
Protestant traditions as a share of all U.S. adults (2023–24)
Label
Bar
Value
Evangelical Protestant
23%
Mainline Protestant
11%
Historically Black Protestant
5%
Max = 23. Widths: Evangelical Protestant 100.00%, Mainline Protestant 47.83%, Historically Black Protestant 21.74%.
Largest Protestant denominational families (share of all U.S. adults)
Looking at denominations (not just “Protestant” overall), Pew reports that Baptists remain the single largest Protestant denominational family in the U.S. (while still smaller than in prior decades), and that nondenominational Protestantism is slightly larger than it was in 2014.
In Pew’s 2023–24 data, Protestants are majority White (non-Hispanic) at 63%, with substantial Black representation (18%) and a meaningful Hispanic share (9%). Within the Historically Black Protestant tradition, Pew reports that 92% of adherents are Black.
Racial and ethnic composition among Protestants (2023–24)
Label
Bar
Value
White (non-Hispanic)
63%
Black (non-Hispanic)
18%
Hispanic (any race)
9%
Asian (non-Hispanic)
3%
Other/Multiracial
5%
No answer
2%
Max = 63. Widths: White (non-Hispanic) 100.00%, Black (non-Hispanic) 28.57%, Hispanic (any race) 14.29%, Asian (non-Hispanic) 4.76%, Other/Multiracial 7.94%, No answer 3.17%.
Education of US Protestants
Protestants span the education spectrum, but Pew’s 2023–24 distribution shows 37% with high school or less and 31% with some college. About 31% combined are college graduates or postgraduates (17% + 14%).
Educational distribution among Protestants (2023–24)
Label
Bar
Value
High school or less
37%
Some college
31%
College graduate
17%
Postgraduate
14%
Max = 37. Widths: High school or less 100.00%, Some college 83.78%, College graduate 45.95%, Postgraduate 37.84%.
Income and gender snapshot
Income (2023–24, Pew): 21% under $30K, 18% $30K–$49,999, 26% $50K–$99,999, and 27% $100K+ (8% no answer).
Gender (2023–24, Pew): 55% woman and 43% man among Protestants (with very small shares selecting another option or not answering).
Sources
Pew Research Center (Feb 26, 2025). “Decline of Christianity in the U.S. Has Slowed, May Have Leveled Off” (Religious Landscape Study 2023–24). https://www.pewresearch.org/religion/2025/02/26/decline-of-christianity-in-the-us-has-slowed-may-have-leveled-off/
Pew Research Center (Feb 26, 2025). “2023-24 Religious Landscape Study: Executive summary.” https://www.pewresearch.org/religion/2025/02/26/religious-landscape-study-executive-summary/
Pew Research Center (2025). 2023–24 U.S. Religious Landscape Study interactive database (Protestants: age, gender, race/ethnicity, education, income tabs). https://www.pewresearch.org/religious-landscape-study/protestant-family/protestant/
Gallup (Apr 17, 2025). “Religious Preferences Largely Stable in U.S. Since 2020.” https://news.gallup.com/poll/659339/religious-preferences-largely-stable-2020.aspx
Take your spiritual journey on the go with the 10 best compact travel Bibles that promise convenience and inspiration—discover which one fits your needs best.
Merging elegance with resilience, discover the 10 best buffalo leather Bibles that promise both style and durability—your perfect spiritual companion awaits!
Open the door to festive transformation with these 10 Christmas bathroom decor sets that will elevate your holiday spirit—discover the perfect style for your home!